Work with the best component for HTML5 Gantt charts

VSW SE GIF-1

The Visual Scheduling Widget is an intuitive tool, that allows you to develop customized, intelligent and interactive HTML5 Gantt charts in a short time. With the widget you get a unique feature set

  • with which you can quickly develop scheduling charts for production planning, project management, staff scheduling, logistics solutions and much more
  • with a flexible API that can be easily integrated into your solution
  • developed by Gantt-experienced developers for HTML5/JavaScript developers working on robust B2B applications

We have been developing Visual Scheduling Tools for more than 3 decades


logo_proconcept_1
logo_softsite
logo_argonne
logo_viewsoftware
logo_Liebherr
logo_gus group
logo_infor
logo_inform

This has convinced our customers


"Freedom of design"

Screenshot Feinplanung ADDONE

For their ADD*ONE simultaneous planning, INFORM needed a planning board that provides an overview, makes it easy to make changes and - very importantly - provides decision support for the planner. INFORM was therefore looking for a component that would allow them to implement a planning board with a great deal of business logic, because the functionality of the planning board is very extensive.

"Three essential points that led us to use the widget from NETRONIC for our detailed planning component: the freedom of design that we gained with the widget, the very close exchange when it came to the composition of the widget, and the good coordination during the planning phase and during the implementation in our product"   - Dr. Adrian Bock from INFORM


"Special context menu"

For employee scheduling of caregivers, Softsite needs to bring in line three parties - the temp agency, the employee and the client. A multi-level context menu is intended to simplify the manual assignment of assignments via the planning board. 

"The context menu, which has up to three levels, is of paramount importance to us. It is designed to enable jumps and shorten typical work steps"  - Andreas Siemoneit from Softsite.

Abfrage Ansicht

Your benefits 

You get a unique package of visual functions


The widget consists of a comprehensive package with all the features for smart and user-friendly HTML5/JavaScript Gantt charts.

You save high development costs by using the widget


Complex visualization requirements are quickly implemented and your developers can concentrate on the development of your planning application.

You get a reliable, professional partner at your side 


We have been developing Gantt components since 1973. 70% of our customers are ERP manufacturers with long-term contractual commitments.

bundle

✔️powerful visualization functions
✔️ easy to integrate
✔️expandable for special functions

PIG

✔️ flexible API
✔️ excellent dokumentation
✔️ in person support

HAND STARS

✔️ innovative
✔️ high customer satisfaction
✔️ international

Widget with extensive function package

Dynamic timescale

Our customers normally use a dynamic timescale that automatically (by mouse-wheel interaction) adjusts to the selected solution, so that the planner can zoom in and out seamlessly. The timescale changes in both directions: from years to months, to weeks, to days, to hours, to minutes, and to seconds. The timescale even allows to scroll left and right.

For Developers - HTML5 Gantt Chart - Feature 1.gif
For Developers - HTML5 Gantt Chart - Feature 2.png

Histogram in Gantt chart row

The benefit of a histogram is obvious: Capacity conflicts at a resource or resource group immediately become apparent. Up to now, histograms were usually shown below the diagram. However, some of our customers want to show histograms within a diagram row, thus shaping the link between allocation and availability more directly. More ideas about how to visualize capacity loads are presented in this blog post.

Visualize dependencies

Complex projects are split into many subprojects with many subtasks. In order not to lose the connection between the task packages and the time overview, links and totals bars belong to the standard visualization of project planning boards. With the Visual Scheduling Widget you can visualize total bars and different links.

For Developers - HTML5 Gantt Chart - Feature 3.png
For Developers - HTML5 Gantt Chart - Feature 4.gif

Build-in animations

Small functions sometimes have great impact. Especially when it comes to expand or collapse bigger groups, users often lose their “visual bearings”. Built-in animations, especially when switching between “showing all nodes in one row” and expanded view, let the user always understand what’s happening on the screen.

Manual allocation of orders, tasks & resources

Backlogs are great tools for giving the planner an overview of unassigned and already assigned tasks, orders or resources and placing them by using drag & drop. A second table can be used to create such a backlog. Various other forms of backlog visualization are described in this blogpost.

VSW SE Backlog Visualisierung

Do you want to evaluate the VSW?  Book a first short introduction meeting, so we can check together if product & price are suitable for you.

Prices

Licenses 

Visual Scheduling Widget - Standard Edition
VSW as defined in FDD & IDD                                   11,000.00 € 

Integration support (budget of max. 16 hrs.)             2,000.00 €

Total                                                                              13,000.00 €


Deployment (B2B)

One time fee (perpetual) per end-customer:              1.900.00 €

Monthly (SaaS) subscription per end-customer:              65.00 €


Maintenance and support /year, including:
- widget bugfixing 
- technical support
- adaption to new browser versions
- new widget versions                                2,200.00 €

Meet our team

We are here to help!

Team Member

Position

Dr. Elmar Karlowitsch

COO | Co-Owner

Elmar joined NETRONIC in 2015 to help his brother Martin grow the company profitably . He drives finance and operations and led the Visual Scheduling Widget Team from the start as a "bring-to-market" manager. In addition to his team leading function he also shares sales representative function with Egon.

Contact Elmar

Team Member

Position

Egon Heutz

Sales & Support

Egon from Belgium is a long-term employee at NETRONIC. He is in close contact with our Gantt control customers as well as Microsoft Dynamics 365 BC / NAV partners especially from France, Belgium, Luxembourg, the Netherlands, Denmark, Sweden, Norway and Finland and supports them in technical and sales related questions. In the Visual Scheduling Widget Team he shares sales representative function with Elmar.

Contact Egon

Team Member

Position

Dieter Temme

Team Leader HTML5 Development | Product Manager

Like Egon, Dieter has been working for NETRONIC for a very long time. He leads the team for our HTML5/JavaScript product lines and has developed the Visual Scheduling Widget as a product. He is a competent contact person for technical questions as well as for the development of individual widgets.  

Contact Dieter

Do you want to evaluate the VSW?  Book a first short introduction meeting, so we can check together if product & price are suitable for you.

More questions about the Visual Scheduling Widget?

Check out our FAQs here or contact us directly

How does the widget embed itself in my application?

How the jQuery UI Gantt widget works

3 principles of the architecture

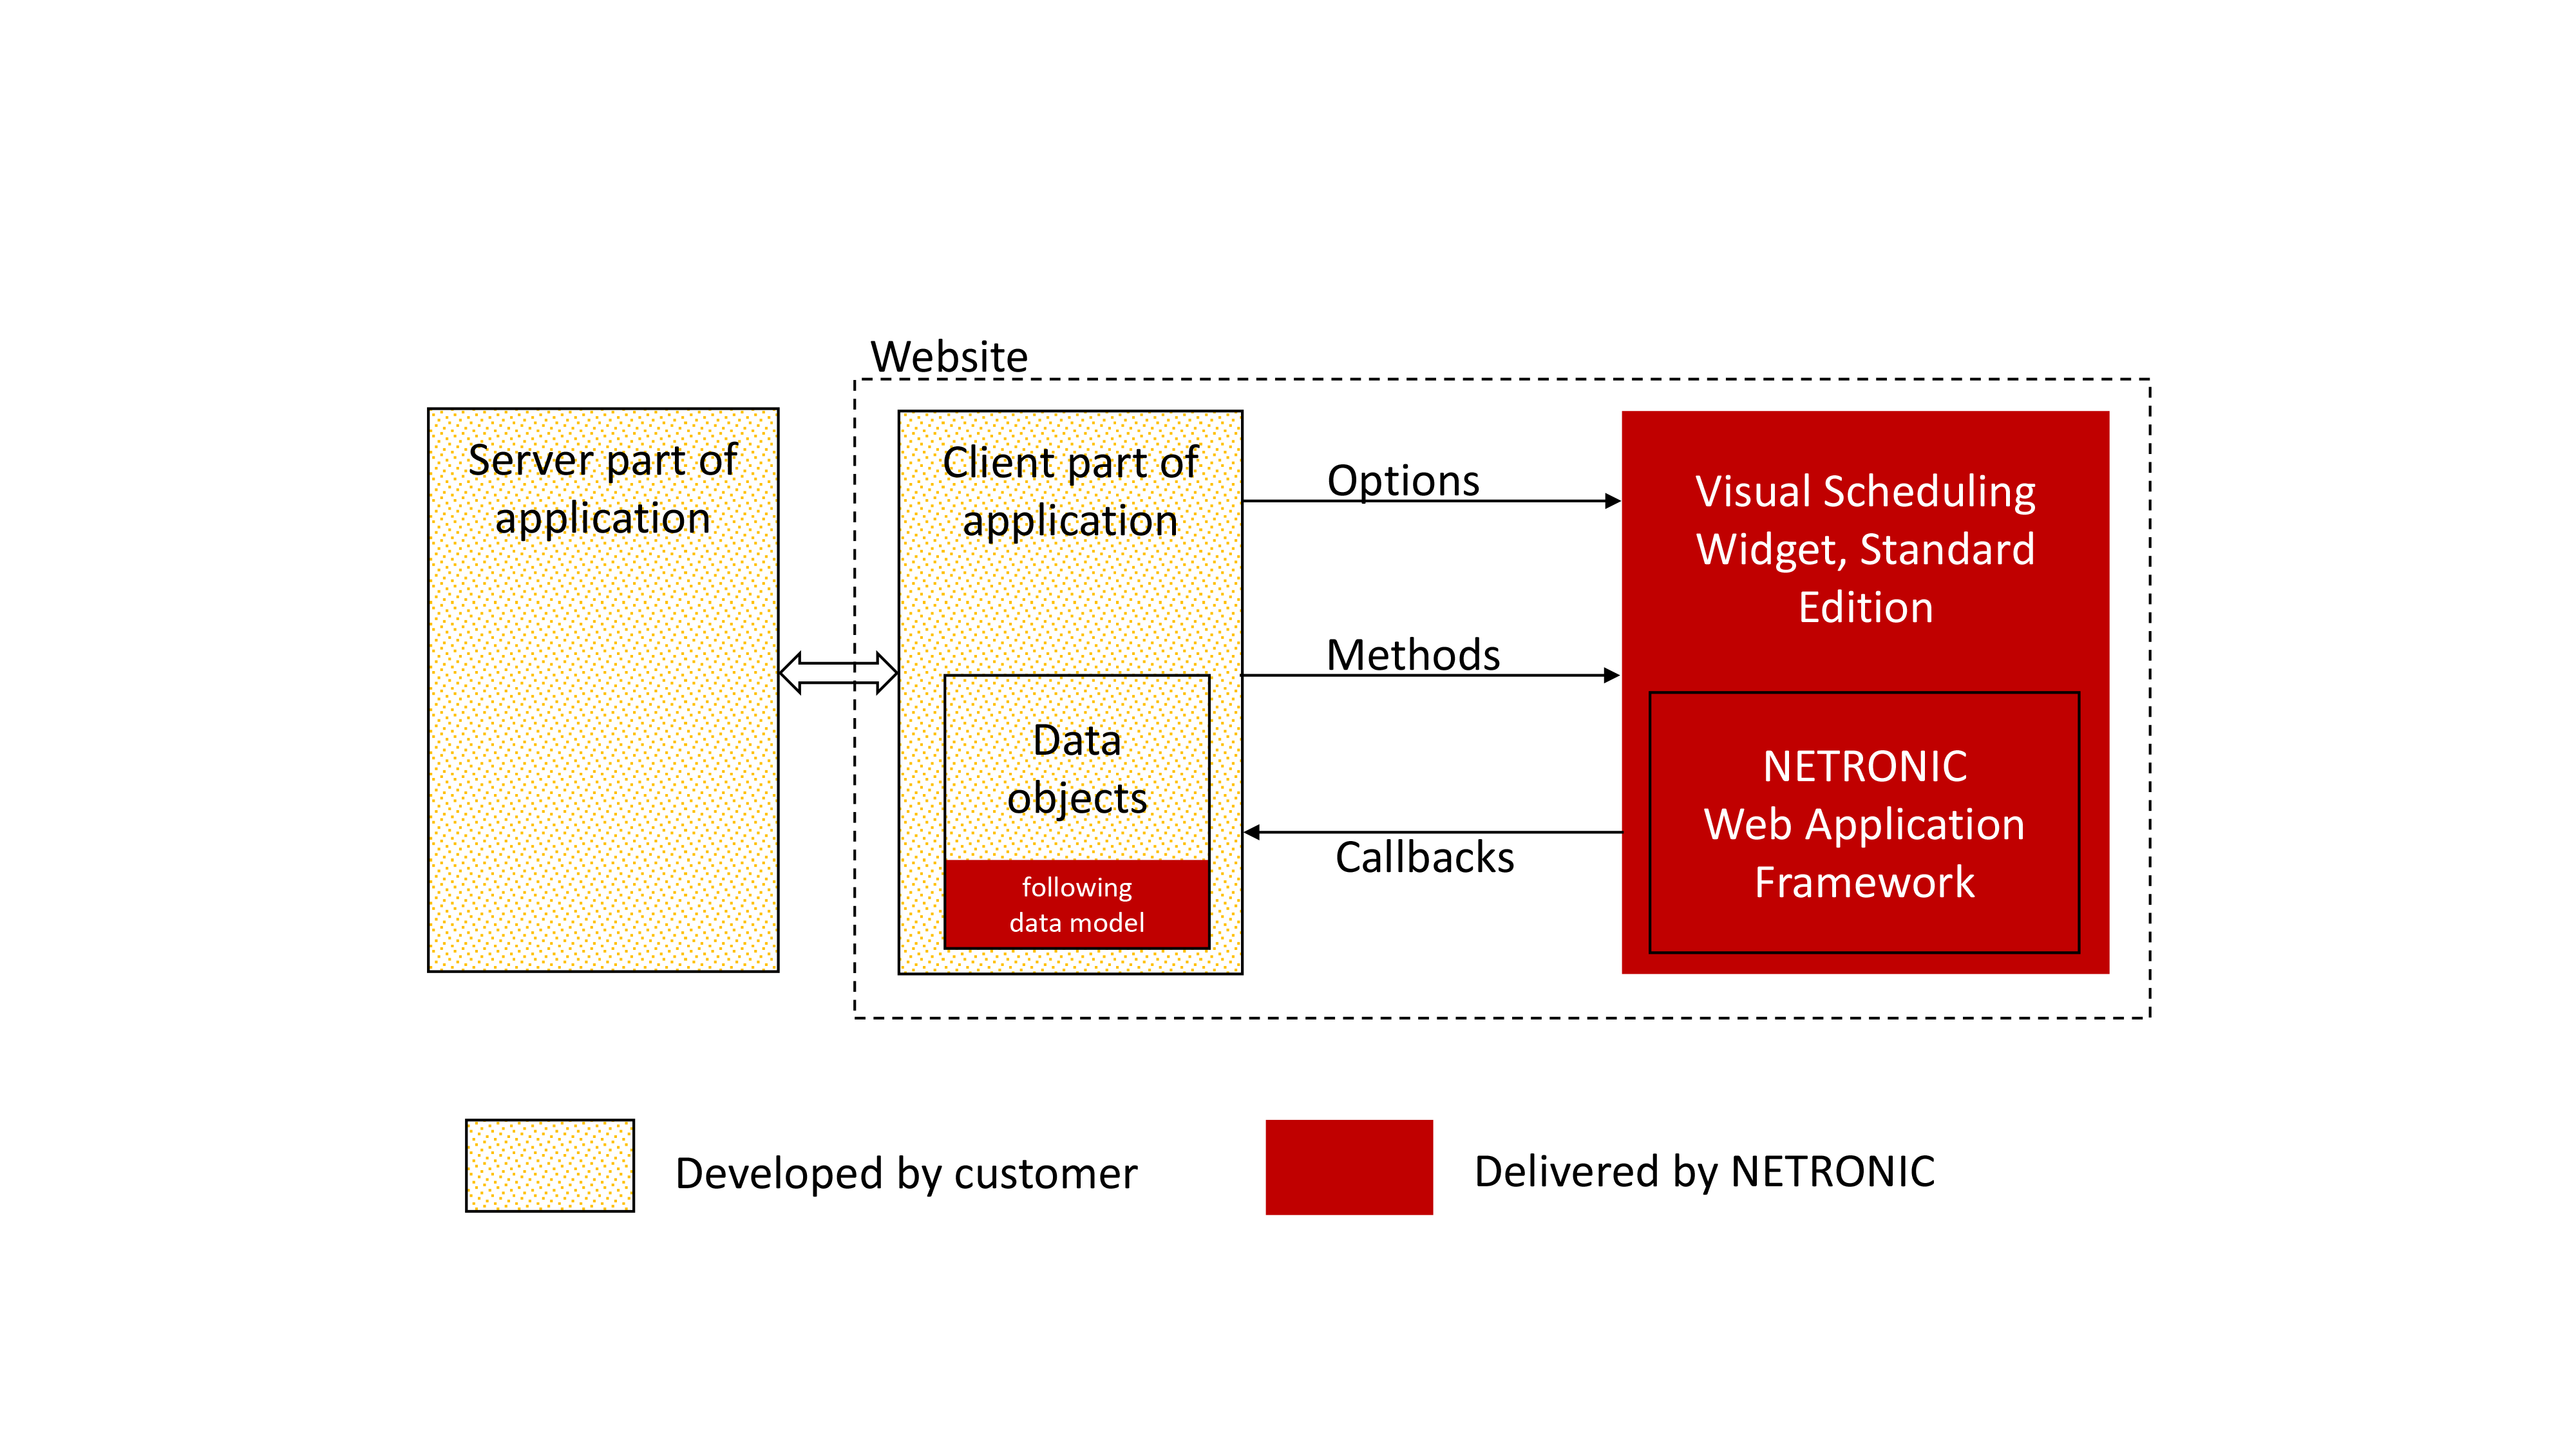
The general architecture of the Visual Scheduling Widget - Standard Edition is based on the following principles:

1. The widget does not manage data within the Gantt chart. All data management functions as well as the
corresponding business logic take place within the customer application.

2. Almost every mouse click on a graphical object (e.g. a Gantt chart bar or a resource row) in the diagram triggers a bidirectional communication between VSW SE and the application (see "Callbacks" and "Options/methods" in the following graphic).

3. This bidirectional communication leads to an exchange of objects, as you can see in the graphic.

Architektur widget1


How can I quickly get started with the Visual Scheduling widget?

A good introduction to working with the widget is given in our Hello Gantt World Video. 

On our YouTube channel there are more How-To videos that give you tips & tricks on topics such as timescales, meaningful bar design, backlog visualization, etc.

Click here for the playlist

Are there any other more advanced technical documents available?

We work with a special data model that focuses on resources. 

In this e-book you will find all the information about the "Model for Resource Planning":

Model for Resource Planning website


We also recommend reading the following documents

Please open the documents by a right-click

I am missing a certain functionality. What can I do?

We can extend the widget with special functionalities. Just contact us.

Do you want to evaluate the VSW?  Book a first short introduction meeting, so we can check together if product & price are suitable for you.

Can I test the the Visual Scheduling Widget for free?

Of course you can test the widget for free. Arrange an appointment with us and we will briefly introduce you to the work with the Visual Scheduling Widget and answer your questions. This will save you time during the evaluation and we can clarify at the beginning to what extent the functionality of the widget is sufficient for you or may need to be supplemented.

Do you want to evaluate the VSW?  Book a first short introduction meeting, so we can check together if product & price are suitable for you.

Follow the blog