
JavaScript Gantt Chart for ISV Extensions in Microsoft Dynamics 365 Business Central
We provide you with a toolbox with AL-API with which you can build your own appropriate planning board for your industry solution.
We call our offer a Visual Scheduling Add-in Developer Toolbox (VSADT). You address it via AL and have the design of the planning board in your hands.

No HTML5/JavaScript knowledge required
Do you want to develop your business solution for Microsoft Dynamics 365 Business Central?
Choose the Visual Scheduling Add-in Developer (VSADT)
Your ISV solution also contains visual planning boards or other visual overviews your customers love very much? You have programming skills in AL but unfortunately, your skills regarding HTML5/JavaSript are not profound enough to develop these overviews? In this respect, we can help you - use our Visual Scheduling Add-in Developer Toolbox (VSADT) that you can integrate in your business solution and access via AL-API.
Save time and money with the Visual Scheduling Add-in Developer toolbox (VSADT)
Benefits:
- You don't have to learn HTML5/JavaScript.
- You can easily access the Gantt chart by an AL-API.
- You stay flexible and can make changes.
- You gain "time-to-market" or "time-to-value".
- You benefit from our decade-long experience in creating user-friendly graphical planning boards.
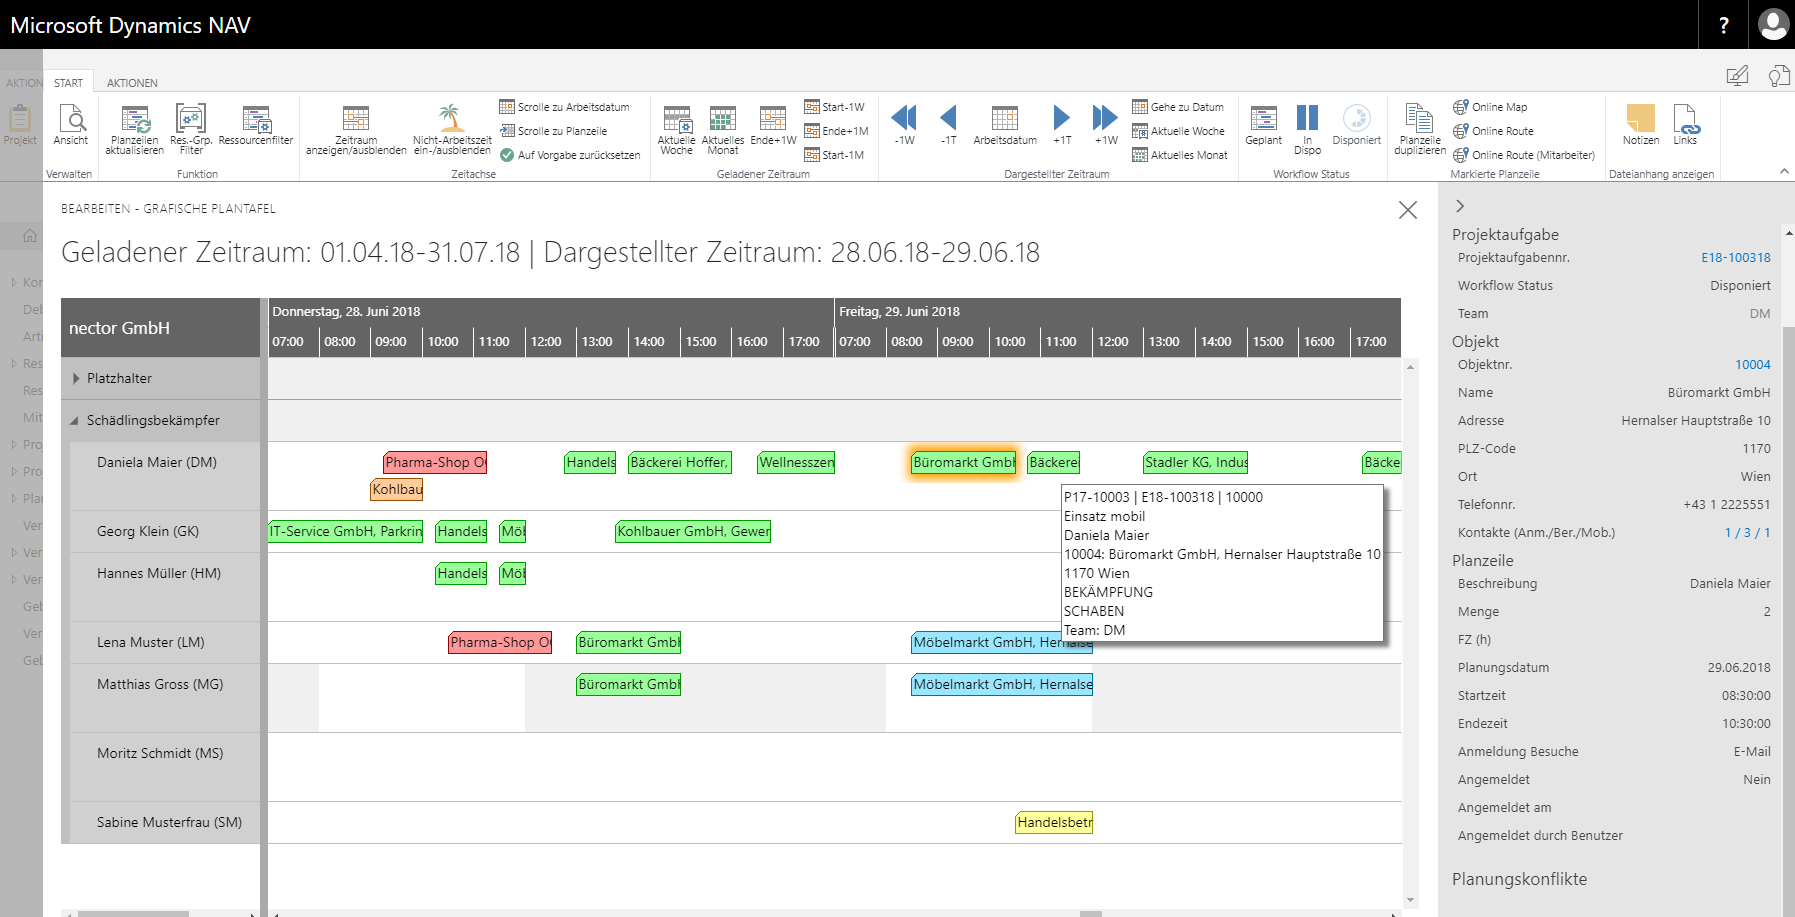
Connection between ISV solution and Visual Scheduling Add-in Developer Toolbox
Division of work: You take care of your business logic, we take care of how you can realize their visualization.
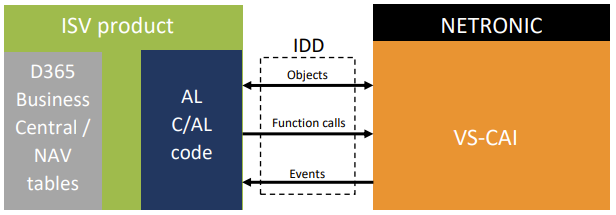
The Visual Scheduling Add-in Developer Toolbox includes features that allow you to design almost any type of planning board. All you have to do is write the AL procedure calls that you use to populate and modify the graphical overview with data.
Using the API, you can control the objects yourself and change the settings as you see fit, without having to be an HTML5 specialist. This way, you get an integrated planning board, but stay master of the business logic.
Reduced effort when developing Gantt charts for your ISV solution
Why it is worth working with the Visual Scheduling Add-in Developer Toolbox
Added value
Visualization makes the planning data of your business solution transparent, clear and understandable. The overviews help customers to make safe decisions and to act quickly. Your business solution gains added value being highly estimated by customers and prospects.
Speed
Since we have an experienced HTML5/JavaScript developer team that puts your requirements effectively into practice the development of the tailor-made visualization of your solution will happen in short time and at low cost. You don't need to invest in expensive HTML5/JavaScript trainings but you can focus on AL and your know-how of your customers' planning requirements.
Reliability
NETRONIC's core competency has always been visualizing data. We put emphasis on high-quality software, a very customer-oriented support, and constant development. We want to create permanent relationships with our customers: many big ERP systems around the world using our software have been working with us for decades.
Five features our customers find important
Table, timescale, bars
The classical structure of a planning board consists of these three elements. You determine the number of hierarchy levels in the table, the behavior of the timescale when maximizing or minimizing the displayed time range, and how much information is to be shown in the bar.

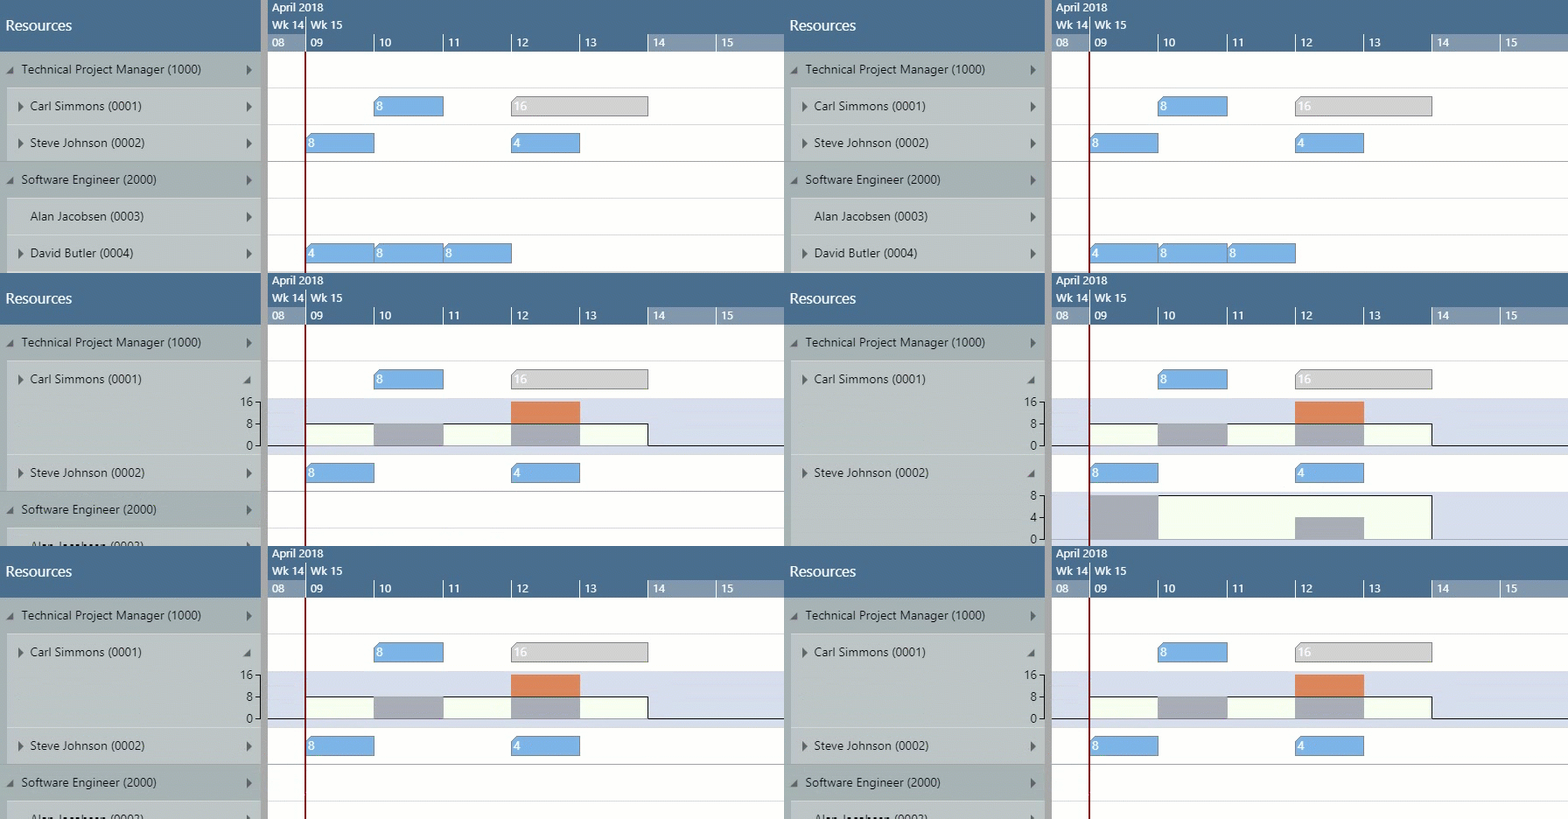
Capacity curve
The capacity curve is an important means of visualization when it comes to controling and managing resources. Usually, the curve is shown as overview above or below the resource, but it can also reflect the capacity of a whole group. We create the visualization form - you equip it with data as you wish. Here are three different ways of visualizing a capacity curve.
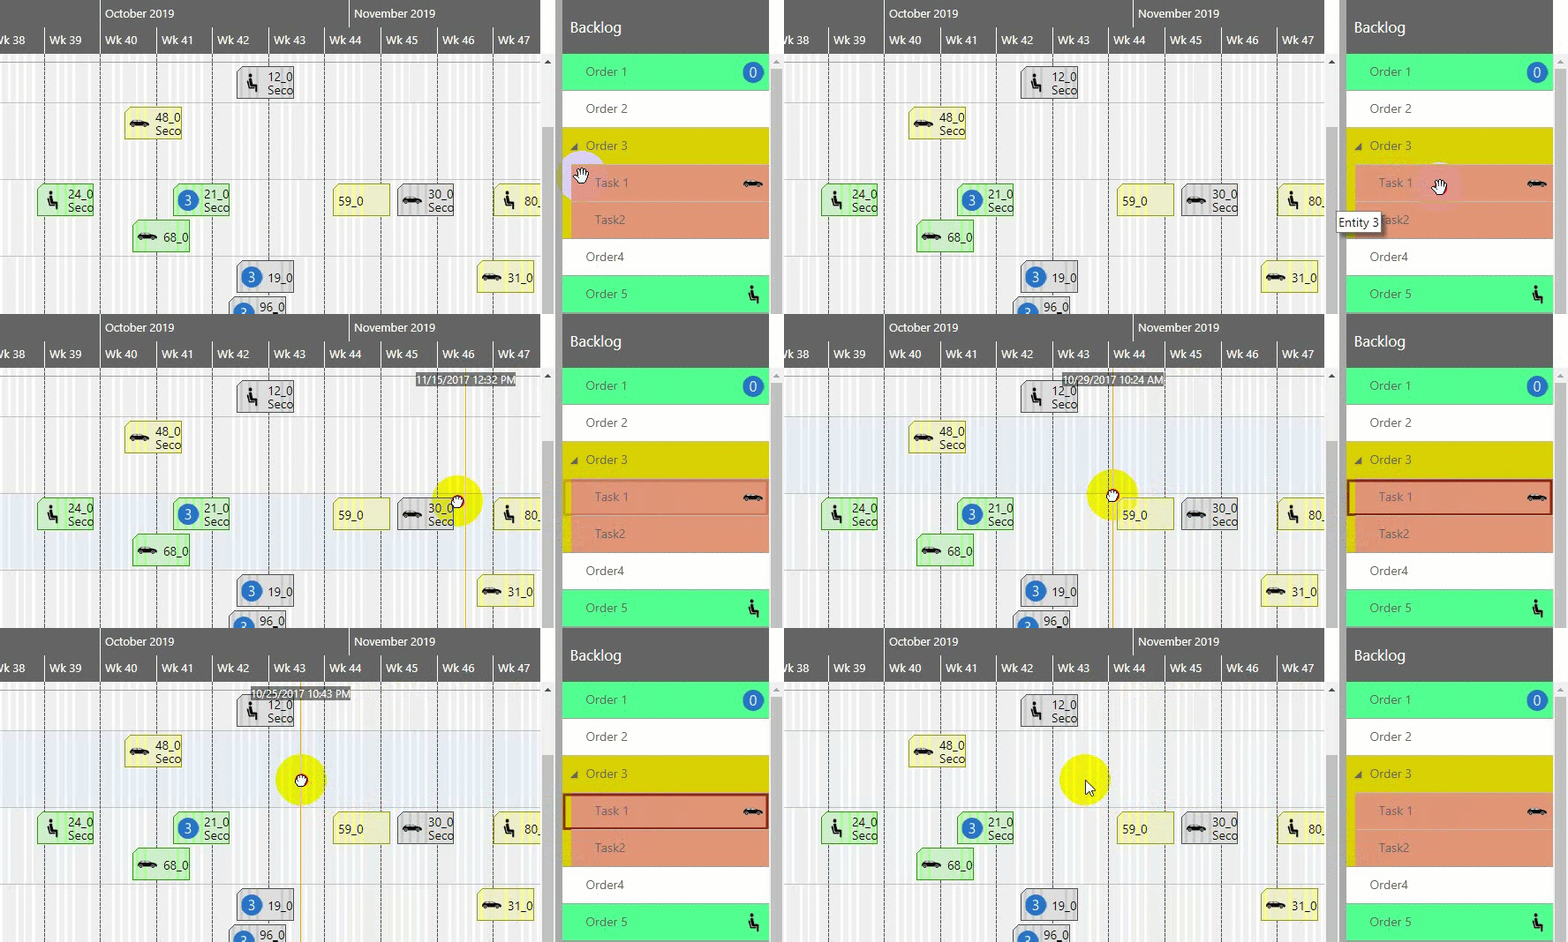
Backlog
The classical structure of a planning board consists of these three elements. You determine the number of hierarchy levels in the table, the behavior of the timescale when maximizing or minimizing the displayed time range, and how much information is to be shown in the bar.
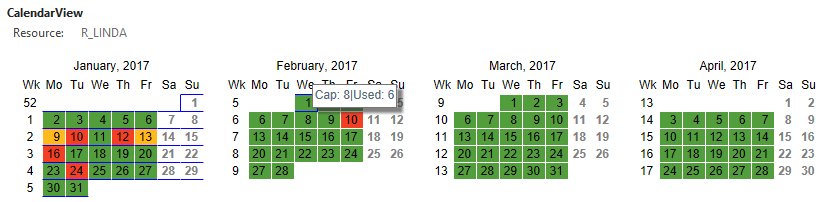
Calendar element
The classical structure of a planning board consists of these three elements. You determine the number of hierarchy levels in the table, the behavior of the timescale when maximizing or minimizing the displayed time range, and how much information is to be shown in the bar.
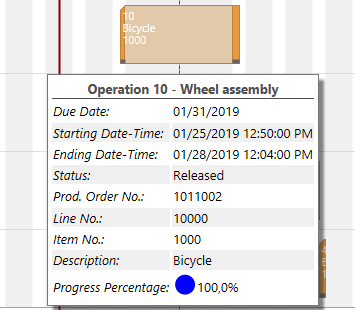
Individual text boxes
The classical structure of a planning board consists of these three elements. You determine the number of hierarchy levels in the table, the behavior of the timescale when maximizing or minimizing the displayed time range, and how much information is to be shown in the bar.
More functionality required?
The Visual Scheduling Add-in Developer Toolbox is extensible
In some cases the Visual Scheduling Add-in Developer Toolbox is not sufficient to design a planning board according to your requirements. No problem - we can add functionality to the Toolbox.
- You discuss your visualization requirements with us.
- We convert them into an FRD (functional requirements document) and an IDD (interface design document).
- Based on the description we develop your individual JavaScript Visual Scheduling Add-in with a specific API.
- You benefit from our knowledge of functional Gantt charts.