No HTML5/JavaScript knowledge required

Visual Scheduling Add-in Developer Toolbox with AL-API

Do you want to develop your business solution for Microsoft Dynamics 365 Business Central? Your ISV solution also contains visual planning boards or other visual overviews your customers love very much? You have programming skills in AL but unfortunately, your skills regarding HTML5/JavaSript are not profound enough to develop these overviews? In this respect, we can help you - use our Visual Scheduling Add-in Developer Toolbox (VSADT) that you can integrate in your business solution and access via AL-API.


Benefits of the Visual Scheduling Add-in Developer Toolbox

Save time and money

- You don't have to learn HTML5/JavaScript
- You can easily access the Gantt chart by an AL-API
 - You stay flexible and can make changes
 - You gain "time-to-market" or "time-to-value".
 - You benefit from our decade-long experience in creating user-friendly graphical planning boards.


  • Staff planning in D 365 BC

How our customers use the VSADT

Interactive planning boards in different industry solutions

Dispatch board for pest controllers

nector furnished their pest control software for Microsoft Dynamics NAV, Pestsoft, with a visual dispatch board, to support their customers in accepting short-term orders more efficiently.

“The impetus for the development came from a customer. Today, however, the positive reactions of customers and prospects make us realize that this  visual planning board brings a huge benefit for pest controllers and with this also for our software.”

Read more

nector Pestsoft dispatch board for pest controlers

Dispatch board for service technicians

The Graphical Dispatch Board in DYSEL is a visual representation of the service schedule by service technicians. It facilitates service planning as the dispatchers can easily and efficiently assign work orders to technicians and optimize the service schedule.

"It (VSADT) is such a versatile, yet an easy-to-use product. We love it!”

Read more

Dysel dispatch board for service technicans

Planning board for print jobs

PrintVis is the Microsoft certified Print MIS. The PV Planning board offers powerful features to help planners to adjust the job schedule quickly and save. 

"Thanks to the powerful features of the NETRONIC toolbox, we are able to make our PrintVis Planning Board even more flexible and user-friendly with every new version we ship. Thus it also becomes more sophisticated and more powerful with each release."

Read more

PrintVis Planning Board for print jobs

Scheduling board for maintenance work orders

Dynaway developed a Scheduling Board add-on for its Enterprise Asset Management (EAM) software, to manually assign work orders to technicians.

"Our vision is to create a better overview of the resources when it comes to maintenance, and the most recognized tool in the market (NETRONIC) empowered us to create this tool"

Read more

Dynaway Scheduling Board add-on for D365 BC

Connection between ISV solution and Visual Scheduling Add-in Developer Toolbox

Division of work: You take care of your business logic, we take care of how you can realize their visualization

Toolbox for individual planning boards for D365 BC / NAV

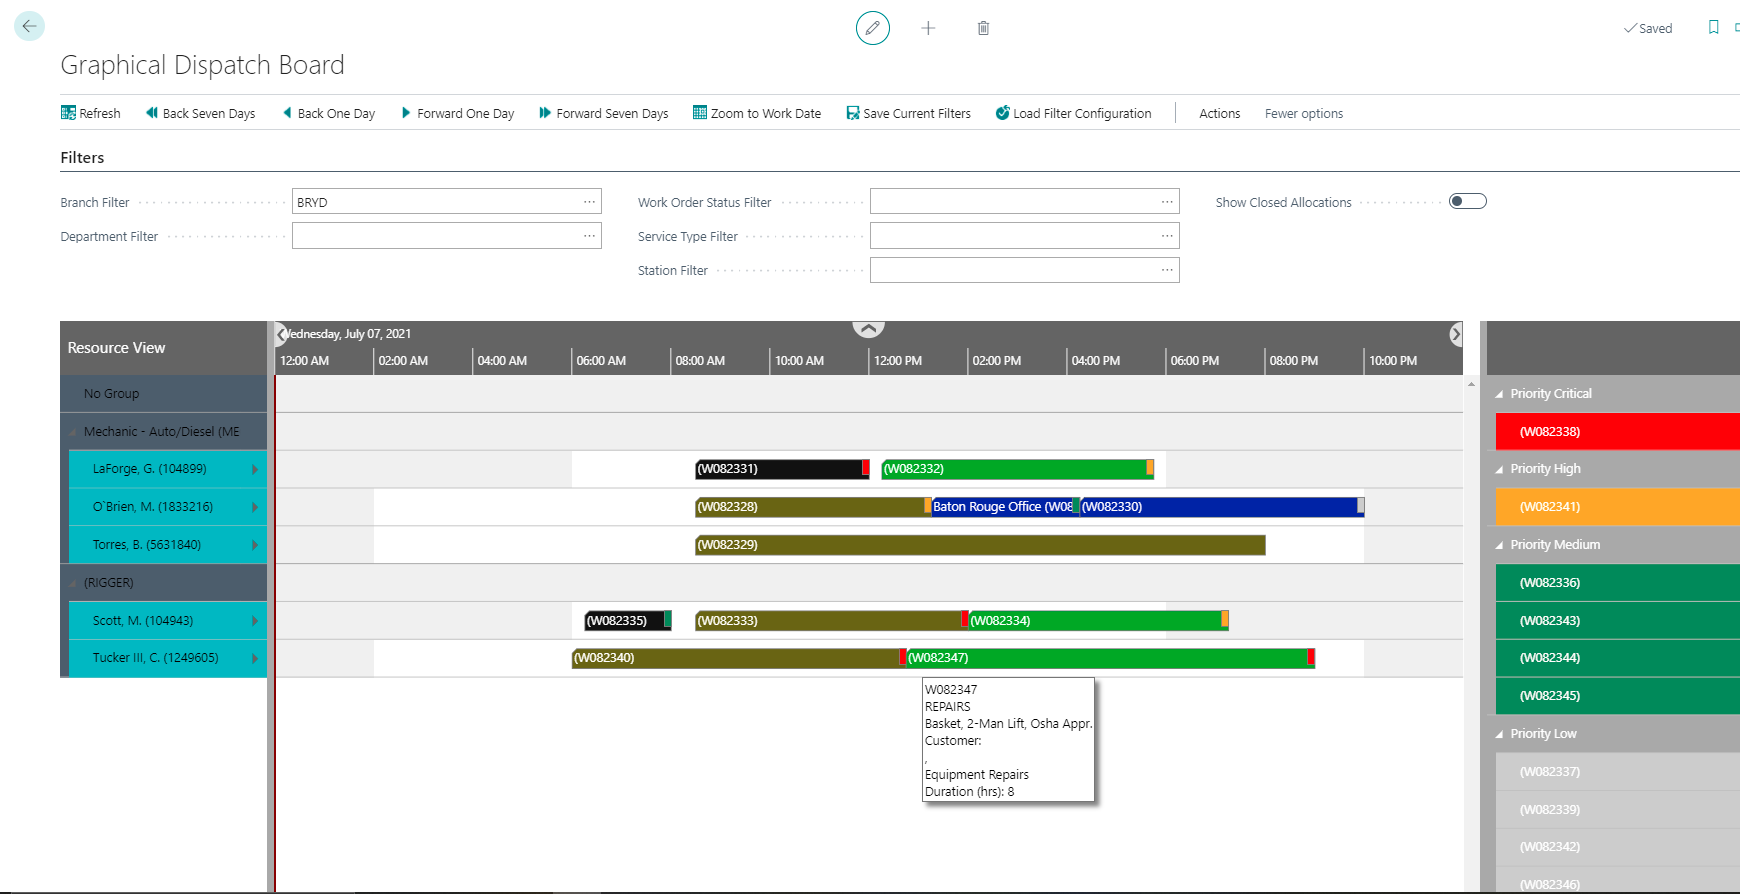
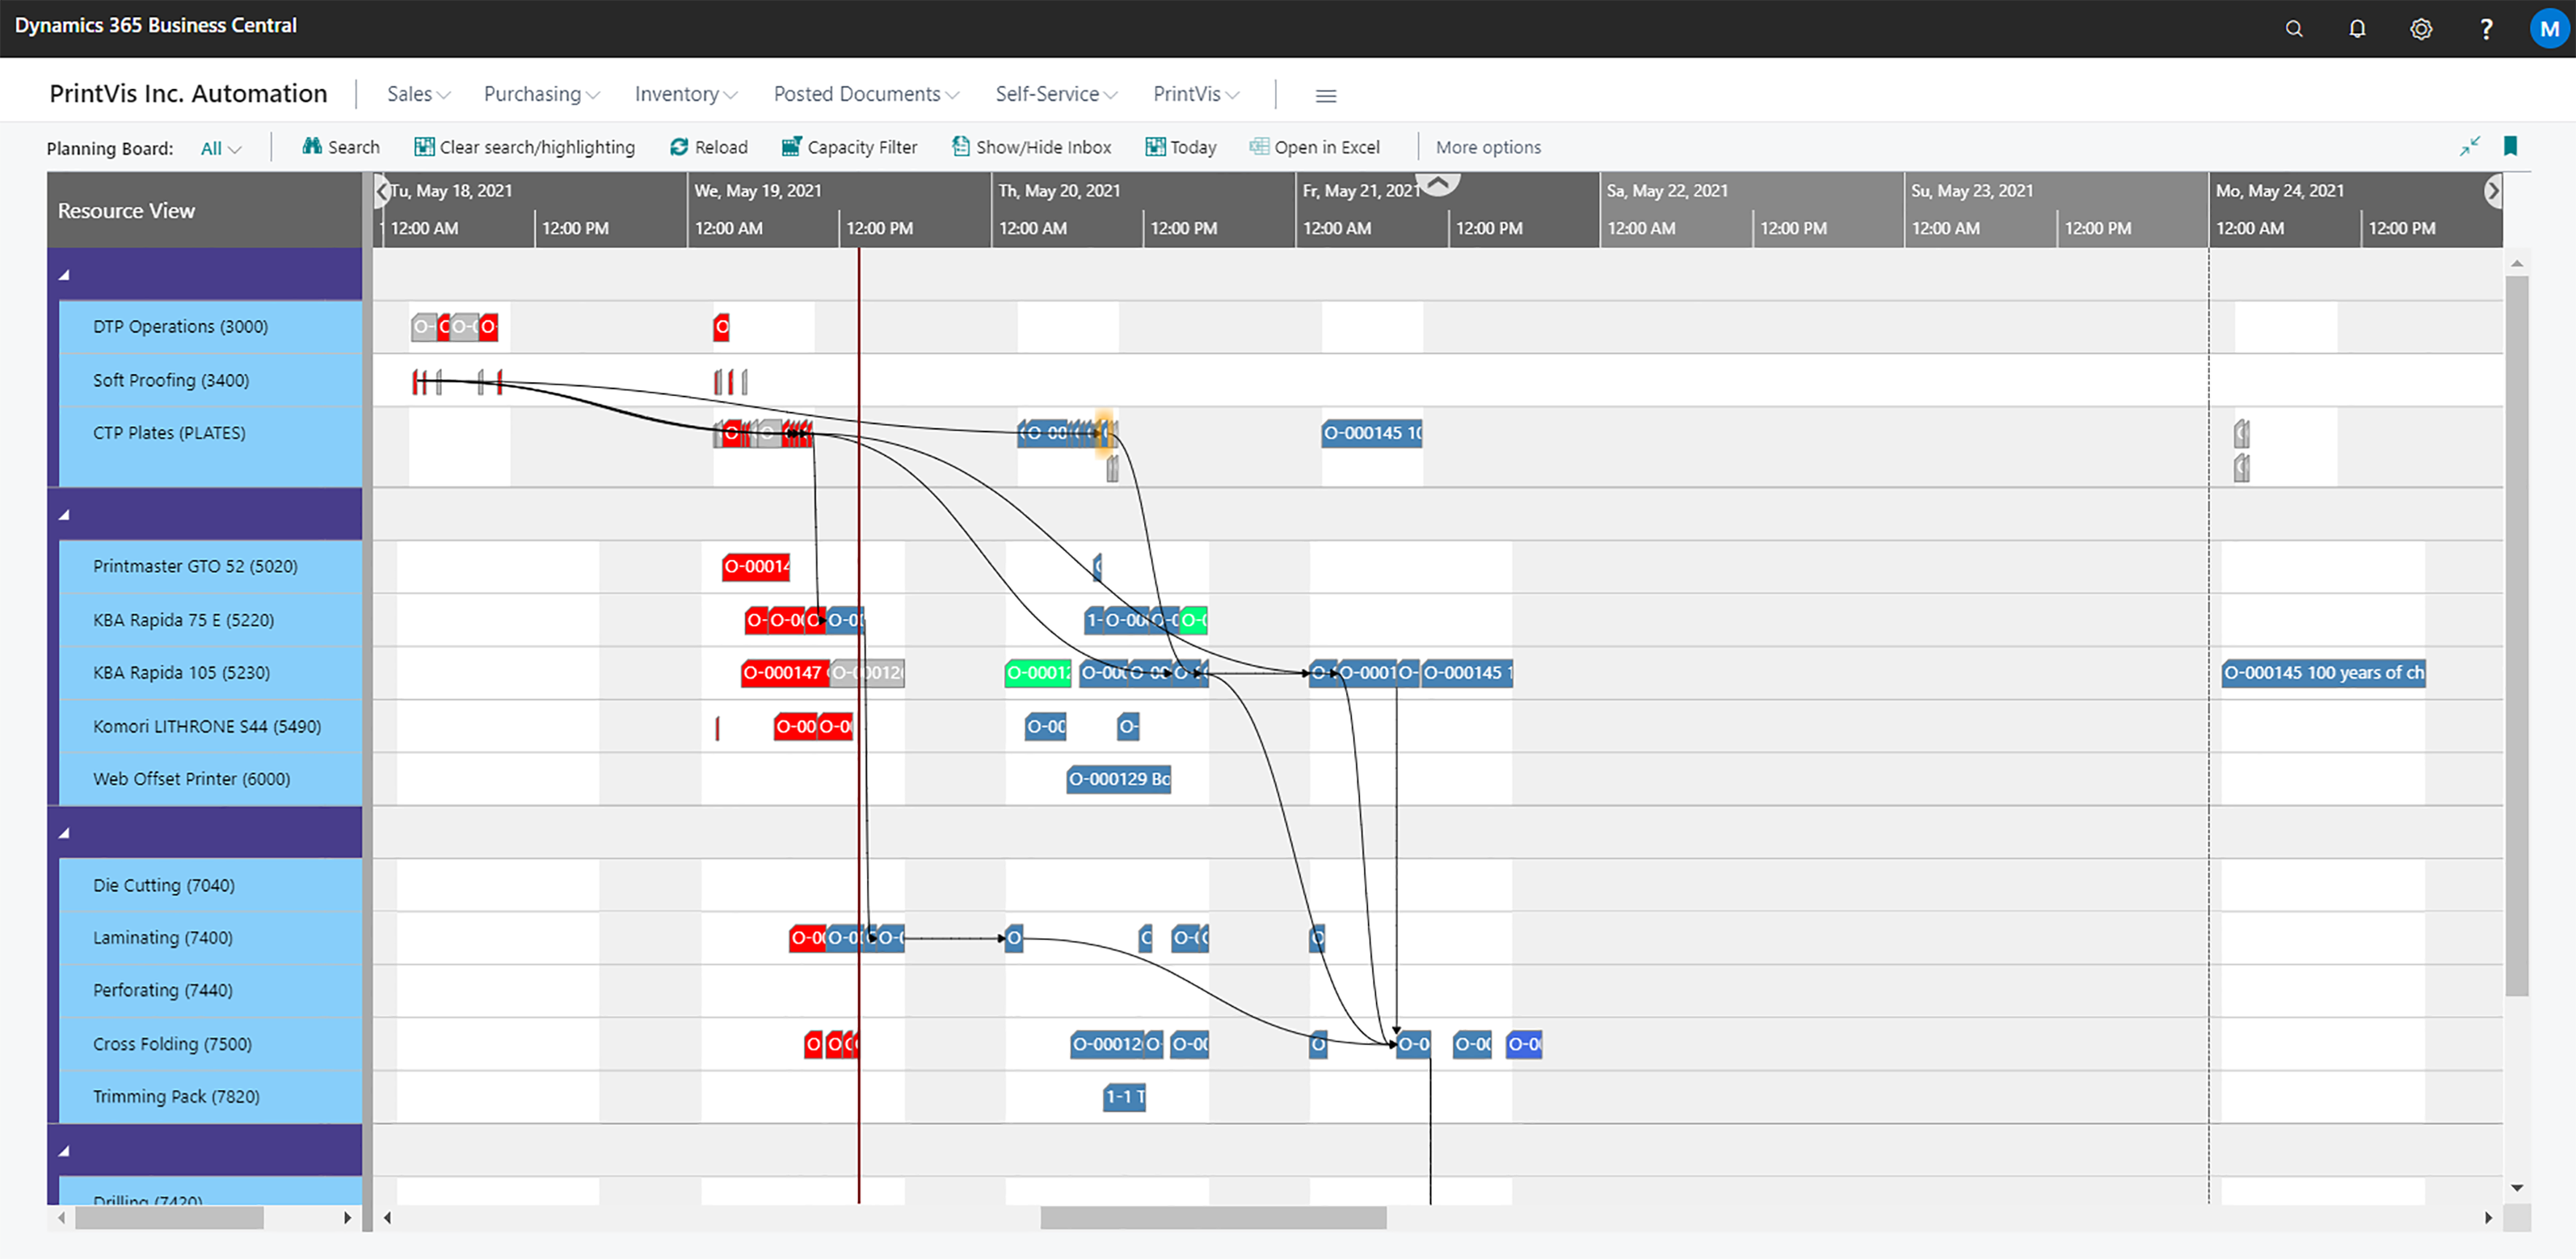
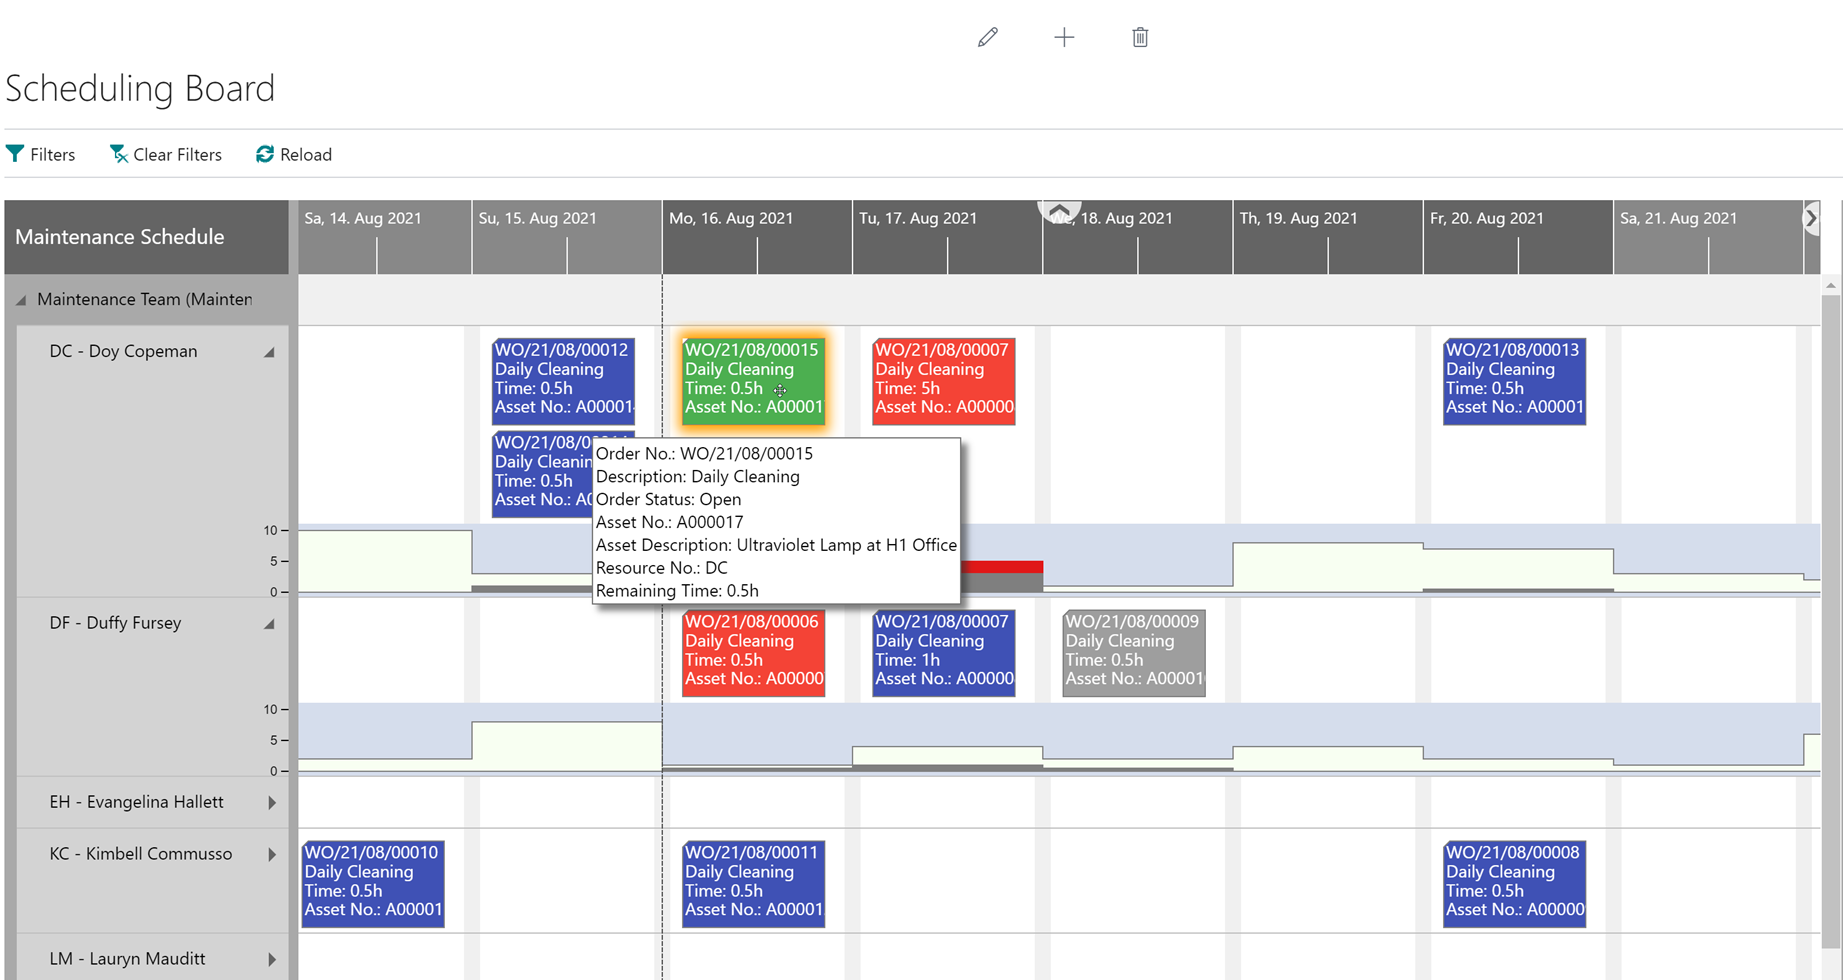
The Visual Scheduling Add-in Developer Toolbox includes features that allow you to design almost any type of planning board. All you have to do is write the AL procedure calls that you use to populate and modify the graphical overview with data. Using the API, you can control the objects yourself and change the settings as you see fit, without having to be an HTML5 specialist. This way, you get an integrated planning board, but stay master of the business logic.


Here is a video, that shows you step by step and with code demo, how to develop your own visual scheduler in AL.


Now you want to develop your own Visual Scheduler? Here you go! Download a free trial version here.

Visual Scheduling Add-in Developer Toolbox TEST NOW

More functionality required?

The Visual Scheduling Add-in Developer Toolbox is extensible

In some cases the Visual Scheduling Add-in Developer Toolbox is not sufficient to design a planning board according to your requirements. No problem - we can add functionality to the Toolbox.

- You discuss your visualization requirements with us.
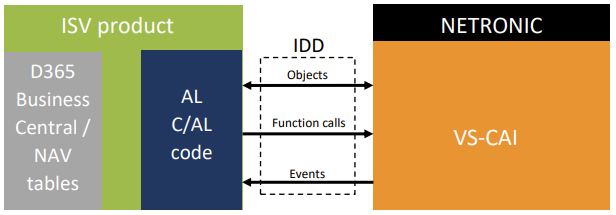
- We convert them into an FRD (functional requirements document) and an IDD (interface design document).
- Based on the description we develop your individual JavaScript Visual Scheduling Add-in with a specific API.
- You benefit from our knowledge of functional Gantt charts.


Please fill out this short questionnaire. We will contact you as soon as possible.


There are no limits for visualization

Five features our customers find important

Table, timescale, bars

The classical structure of a planning board consists of these three elements. You determine the number of hierarchy levels in the table, the behavior of the timescale when maximizing or minimizing the displayed time range, and how much information is to be shown in the bar.

JavaScript Gantt charts for D365 BC
JavaScript Gantt charts with capacity curves

Capacity curve

The capacity curve is an important means of visualization when it comes to controling and managing resources. Usually, the curve is shown as overview above or below the resource, but it can also reflect the capacity of a whole group. We create the visualization form - you equip it with data as you wish. Here are three different ways of visualizing a capacity curve.

Backlog

Our customers use very different backlog forms to allocate tasks to resources: a table, a kind of tree chart, a second Gantt... This blogpost gives you an idea of all the different ways of using an order backlog.

Different backlog visualization in JavaScript Gantt charts for D365 BC
JavaScript Gantt chart with calender view for capacity control in D365 BC

Calendar element

With alternative and aggregated calendar types we can condense information and enable quickly navigating the Gantt chart.

Individual text boxes

Summing up information in an overview creates transparency, but showing too much details will create chaos. This dilemma can be solved by text boxes showing details on click or mouse-over - whenever they are needed.

Tooltip in JavaScript Gantt charts for D365 BC

Ebook

Developing a Gantt Chart Scheduler for Microsoft Dynamics NAV and 365 Business Central

Would you like to take a deeper dive into our concept of developing a Gantt chart scheduler for Microsoft Dynamics Business Central as part of an ISV solution? Read our ebook or visit our website.

Series of blog posts 

Interviews with our developers and project managers give you an insight into the concept behind the product and how we use the toolbox ourselves.
Here is post #1.


Visual Scheduling Add-In Developer Toolbox Interviews

Follow our blog

We regularly blog about our visual scheduling add-ins. Here is what we published recently: